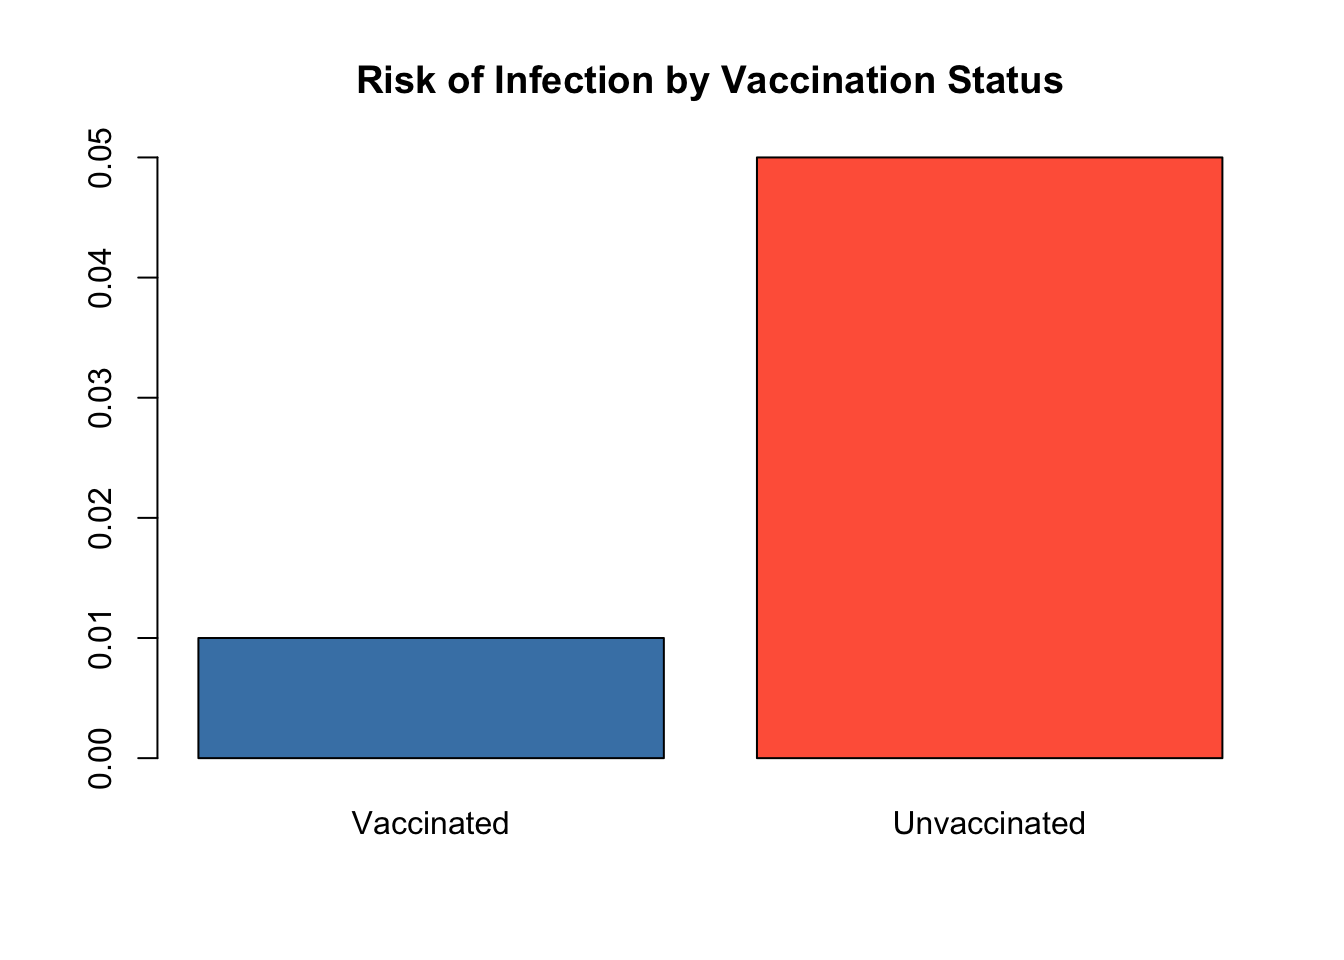
group <- c("Vaccinated", "Unvaccinated")
cases <- c(5, 25)
population <- c(500, 500)
risk <- cases / population
barplot(
  risk,
  names.arg = group,
  col = c("steelblue", "tomato"),
  main = "Risk of Infection by Vaccination Status"
)
An outbreak of measles, a highly contagious viral disease, occurred in a semi-urban community with mixed vaccination coverage. Measles is one of the most transmissible infectious diseases, with a basic reproduction number (R₀) often estimated between 12 and 18.
Public health teams initiated an outbreak investigation to:
identify confirmed and suspected cases
determine vaccination status
assess transmission patterns
estimate the real-world effectiveness of the vaccine
For an overview of measles epidemiology, see: https://www.who.int/news-room/fact-sheets/detail/measles
Vaccine effectiveness (VE) refers to how well a vaccine performs in real-world conditions, outside controlled clinical trials.
Unlike vaccine efficacy, effectiveness reflects:
population diversity
variation in exposure
real-world healthcare access
behavioural factors
👉 Learn more: https://www.who.int/news-room/feature-stories/detail/vaccine-efficacy-effectiveness-and-protection
Estimating vaccine effectiveness is essential for:
evaluating vaccination programmes
identifying vulnerable populations
informing outbreak response
guiding policy decisions
For further reading: https://pmc.ncbi.nlm.nih.gov/articles/PMC6734418/
Vaccine effectiveness measures the reduction in disease risk among vaccinated individuals compared to unvaccinated individuals in real-world conditions.
The following table summarises the number of cases and non-cases among vaccinated and unvaccinated individuals during the outbreak.
| Group | Cases (a, c) | Non-cases (b, d) |
|---|---|---|
| Vaccinated | 4 | 96 |
| Unvaccinated | 20 | 80 |
Vaccine effectiveness is calculated as:
VE = (1 − Relative Risk) × 100
Calculate risk in the vaccinated group: 5 / 500 = 0.01
Calculate risk in the unvaccinated group: 25 / 500 = 0.05
Relative Risk = 0.01 / 0.05 = 0.2
VE = (1 − 0.2) × 100 = 80%
Why might vaccine effectiveness differ between populations?
Differences in exposure, population structure, healthcare access, and underlying health conditions can influence estimates.
Distribution Explorer: Health-Related Measures — open in a new window
group <- c("Vaccinated", "Unvaccinated")
cases <- c(5, 25)
population <- c(500, 500)
risk <- cases / population
barplot(
  risk,
  names.arg = group,
  col = c("steelblue", "tomato"),
  main = "Risk of Infection by Vaccination Status"
)
group <- c("Vaccinated", "Unvaccinated")
cases <- c(5, 25)
population <- c(500, 500)
risk <- cases / population
barplot(
risk,
names.arg = group,
col = c("steelblue", "tomato"),
main = "Risk of Infection by Vaccination Status"
)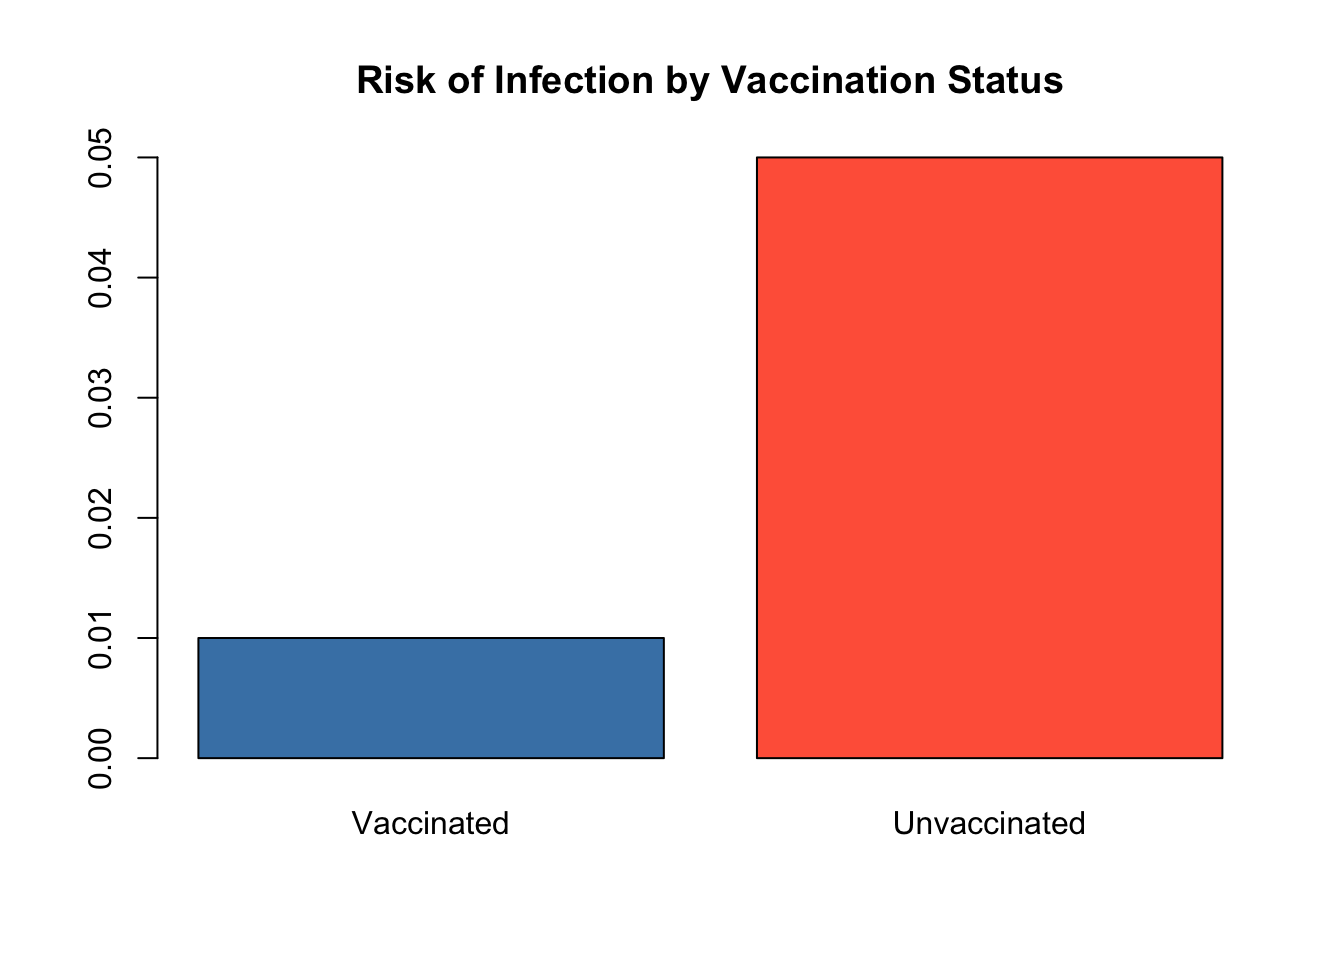
An 80% vaccine effectiveness means vaccinated individuals have substantially lower risk compared to unvaccinated individuals.
The calculation assumes both groups are comparable and equally exposed.
Confounding factors such as age, immunity, or healthcare access may influence results.
Which R code correctly identifies patients with systolic blood pressure greater than or equal to 140 mmHg?
Select one answer.
The following code uses dplyr and the correct comparison operator:
patients |>
dplyr::filter(systolic_bp >= 140)
Correct. The >= operator retains patients with systolic blood pressure equal to or above 140 mmHg.
This includes a reading of exactly 140.
The following code selects values below 140:
patients |>
dplyr::filter(systolic_bp < 140)
Not quite. The < operator selects patients below the threshold rather than those at or above it.
The following code only selects readings above 140:
patients |>
dplyr::filter(systolic_bp > 140)
Not quite. This excludes patients whose systolic blood pressure is exactly 140 mmHg.
Explanation:
The correct expression is systolic_bp >= 140.
The >= operator includes values greater than 140 and values equal to 140. This makes it appropriate when 140 mmHg is part of the threshold.
Look for the operator that means greater than or equal to.
Which expression correctly calculates vaccine effectiveness from a risk ratio?
Select one answer.
Vaccine effectiveness is calculated as:
\[ VE = (1-RR)\times 100 \]
where (RR) is the risk ratio comparing vaccinated and unvaccinated groups.
Correct. Vaccine effectiveness represents the proportional reduction in risk associated with vaccination.
For example, if (RR=0.30), then (VE=70%).
Vaccine effectiveness is the risk ratio multiplied by 100:
\[ VE = RR\times 100 \]
Not quite. This converts the risk ratio into a percentage but does not calculate the reduction in risk.
Vaccine effectiveness is calculated by subtracting the risk ratio from 100:
\[ VE = 100-RR \]
Not quite. The risk ratio is normally expressed as a proportion and must first be subtracted from 1.
Explanation:
The correct formula is:
\[ VE = (1-RR)\times 100 \]
If the risk ratio is (0.30), the calculation is:
\[ VE = (1-0.30)\times 100 = 70\% \]
This indicates that vaccination is associated with a 70% reduction in risk.
Vaccine effectiveness measures the proportional reduction in risk among vaccinated people.
Simple Single-Select Quiz
Which expression correctly calculates vaccine effectiveness?
Select one answer.
Explanation:
The correct formula is VE = (1 − RR) × 100.
Vaccine effectiveness measures the proportional reduction in risk.
Which R expressions would retain a patient whose systolic blood pressure is exactly 140 mmHg?
Select all that apply.
patients |>
dplyr::filter(systolic_bp >= 140)
Correct. The >= operator includes 140.
patients |>
dplyr::filter(systolic_bp == 140)
Correct. The == operator selects readings that are exactly 140.
patients |>
dplyr::filter(systolic_bp > 140)
This excludes 140 because it only accepts values greater than 140.
patients |>
dplyr::filter(systolic_bp < 140)
This selects readings below 140.
Explanation:
Both >= 140 and == 140 retain a value of exactly 140.
However, they have different meanings: >= 140 also includes higher readings, while == 140 only includes readings equal to 140.
More than one expression can include a reading of exactly 140.
Vaccination significantly reduces the likelihood of infection and severe disease, even if it does not eliminate risk entirely.
\[(x + a)^{n} = \sum_{k = 0}^{n}{\binom{n}{k}x^{k}a^{n - k}}\]
Display equation example
\[ P(X=x)=\binom{n}{x}p^x(1-p)^{n-x} \]
WHO Measles Fact Sheet : https://www.who.int/news-room/fact-sheets/detail/measles Vaccine Effectiveness Overview : https://www.who.int/news-room/feature-stories/detail/vaccine-efficacy-effectiveness-and-protection Measles Vaccine Impact Study : https://pmc.ncbi.nlm.nih.gov/articles/PMC6734418/